UV-Vis spectrophotometry functions as the definitive quantitative analyzer in transdermal drug absorption studies. By measuring the light absorbance of a sample at specific wavelengths—such as 395 nm for certain progesterone complexes—it converts physical optical data into precise concentration metrics. This process allows researchers to determine exactly how much drug has dissolved in a solvent (like methanol) after penetration testing, providing the hard numbers needed to assess the efficiency of drug derivatives compared to standard enhancers.
The core value of this technology lies in its ability to translate raw absorbance data into actionable concentration profiles. It provides the empirical evidence required to verify if a specific drug derivative offers superior penetration efficiency through simulated membrane layers compared to existing formulation standards.
The Mechanism of Quantitative Analysis
Correlating Absorbance with Concentration
The fundamental principle involves measuring how a drug or its derivative absorbs light at a characteristic wavelength. For example, specific progesterone complexes are analyzed at 395 nm, while Meloxicam might be targeted at 360 nm.
The Role of Calibration
To achieve precision, researchers utilize a standard calibration curve. By comparing the absorbance of the unknown sample against this curve, the instrument calculates the exact concentration of the drug within the solvent.
Handling Complex Derivatives
Some drugs require chemical modification to be detected effectively. The primary application often involves analyzing colored complexes or derivatives, ensuring that even compounds with low natural absorbance can be quantified accurately.
Analyzing Permeation and Penetration Profiles
Measuring Layer-by-Layer Absorption
A critical function of UV-Vis spectrophotometry is determining the drug distribution across different barriers. It calculates the percentage of the drug absorbed by each specific layer of a simulated membrane.
Analyzing Receptor Fluids
Beyond the membrane itself, the equipment analyzes the receptor fluid or extraction solutions. This determines the total amount of drug that has successfully passed through the barrier into the receiving medium.
Assessing Enhancer Efficiency
The quantitative data derived from these measurements allows for direct comparison. Researchers use the concentration figures to evaluate whether specific chemical derivatives penetrate the skin more efficiently than standard chemical enhancers.
From Raw Data to Pharmacokinetic Models
Constructing Cumulative Release Curves
By measuring concentration across multiple time points, researchers can plot cumulative permeation curves. These visual models illustrate the rate and extent of drug delivery over time.
Verifying Kinetic Models
The data confirms whether the drug release follows established theoretical frameworks. For instance, the analysis helps determine if the release mechanism is Fickian (diffusion-controlled) or follows a non-Fickian model.
Ensuring Content Uniformity
Before permeation testing even begins, UV-Vis is used to verify the baseline. It ensures that the drug loading in the patch meets design standards (e.g., 7.5mg per patch) and is uniform across different units.
Understanding the Trade-offs and Limitations
Specificity and Wavelength Selection
Success depends entirely on selecting the correct wavelength (e.g., 227 nm, 276 nm, or 328 nm depending on the drug). If the wavelength is incorrect or if the solvent interferes with that wavelength, the concentration data will be flawed.
Requirement for Derivatization
As noted with progesterone, some drugs may need to be converted into colored complexes to be read at specific wavelengths (like 395 nm). This adds a step to the workflow and requires strict chemical control to ensuring the derivative accurately represents the parent drug concentration.
Making the Right Choice for Your Goal
When utilizing UV-Vis spectrophotometry for transdermal studies, align your analysis with your specific objective:
- If your primary focus is Efficacy Comparison: Focus on the layer-by-layer absorption percentage to definitively prove if your derivative outperforms standard enhancers.
- If your primary focus is Release Kinetics: Use multi-point time analysis of the receptor fluid to construct cumulative release curves and identify the kinetic model (Fickian vs. Non-Fickian).
- If your primary focus is Quality Control: Utilize the instrument to verify content uniformity and total drug loading prior to starting permeation experiments.
The ultimate goal of UV-Vis spectrophotometry in this context is to move beyond theoretical design and provide the validated, quantitative proof required to optimize transdermal formulations.
Summary Table:
| Application Area | Key Function | Benefit for R&D |
|---|---|---|
| Concentration | Measures absorbance vs. calibration | Provides precise quantitative metrics |
| Permeation | Analyzes receptor fluid & membranes | Verifies penetration and barrier efficiency |
| Release Kinetics | Plots cumulative release curves | Confirms drug delivery timing and mechanism |
| Quality Control | Checks content uniformity | Ensures manufacturing standards and dosage |
Optimize Your Transdermal Formulations with Enokon
At Enokon, we combine scientific precision with advanced manufacturing to deliver high-performance transdermal solutions. As a trusted brand and manufacturer, we offer comprehensive wholesale options and custom R&D services tailored to your specific needs.
Our expertise covers a wide range of transdermal drug delivery products (excluding microneedle technology), including:
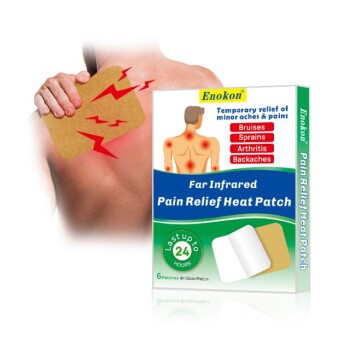
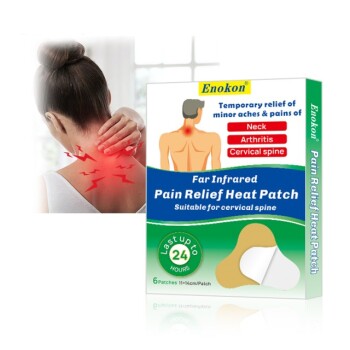
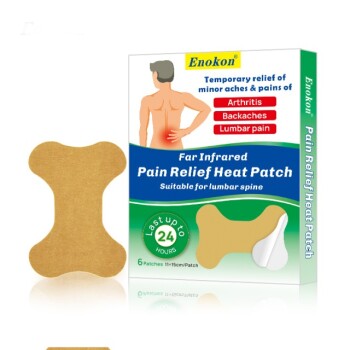
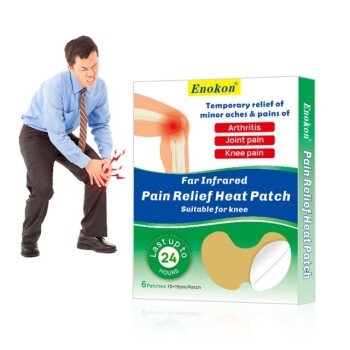
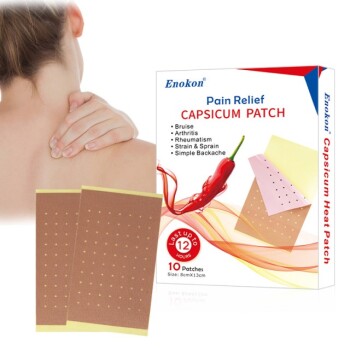
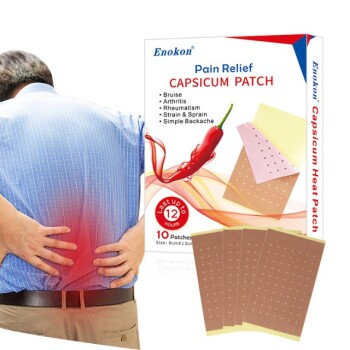
- Pain Relief: Lidocaine, Menthol, Capsicum, and Far Infrared patches.
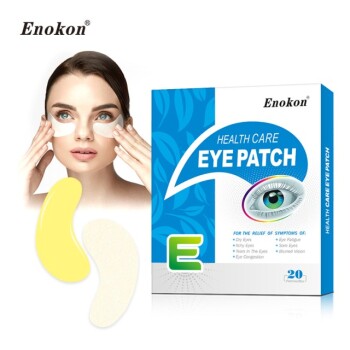
- Wellness & Specialty: Herbal, Detox, Eye Protection, and Medical Cooling Gel patches.
Whether you are looking for a reliable wholesale partner or expert R&D to develop a unique formulation, Enokon provides the technical excellence required to ensure drug absorption and efficacy.
Ready to elevate your product line with science-backed transdermal patches?
Contact Enokon Today for Custom R&D & Wholesale Solutions
References
- Barbara Bednarczyk–Cwynar, Lucjusz Zaprutko. Simple Amides of Oleanolic Acid as Effective Penetration Enhancers. DOI: 10.1371/journal.pone.0122857
This article is also based on technical information from Enokon Knowledge Base .
Related Products
- Far Infrared Heat Pain Relief Patches Transdermal Patches
- Icy Hot Menthol Medicine Pain Relief Patch
- Silicone Scar Sheets Patch Transdermal Drug Patch
- Menthol Gel Pain Relief Patch
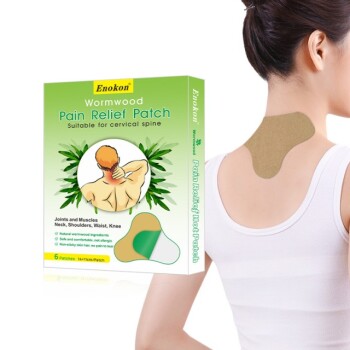
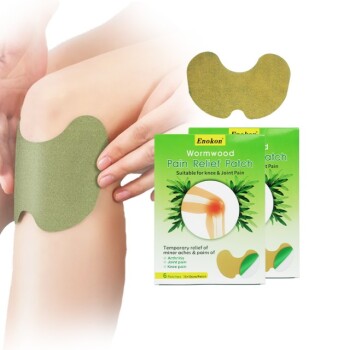
- Mugwort Wormwood Pain Relief Patch for Neck Pain
People Also Ask
- What role does a desiccator play in the moisture content analysis of transdermal patches? Ensure Stability and Safety
- What factors influence the effectiveness of transdermal patches? Key Considerations for Optimal Drug Delivery
- Can all medications be made into transdermal forms? Understanding the Limits of Skin Delivery
- What is the purpose of vacuum filtration for polymer solutions? Ensuring Quality in Transdermal Patch Manufacturing
- How do transdermal patches improve medication adherence? Enhance Treatment Compliance with Ease